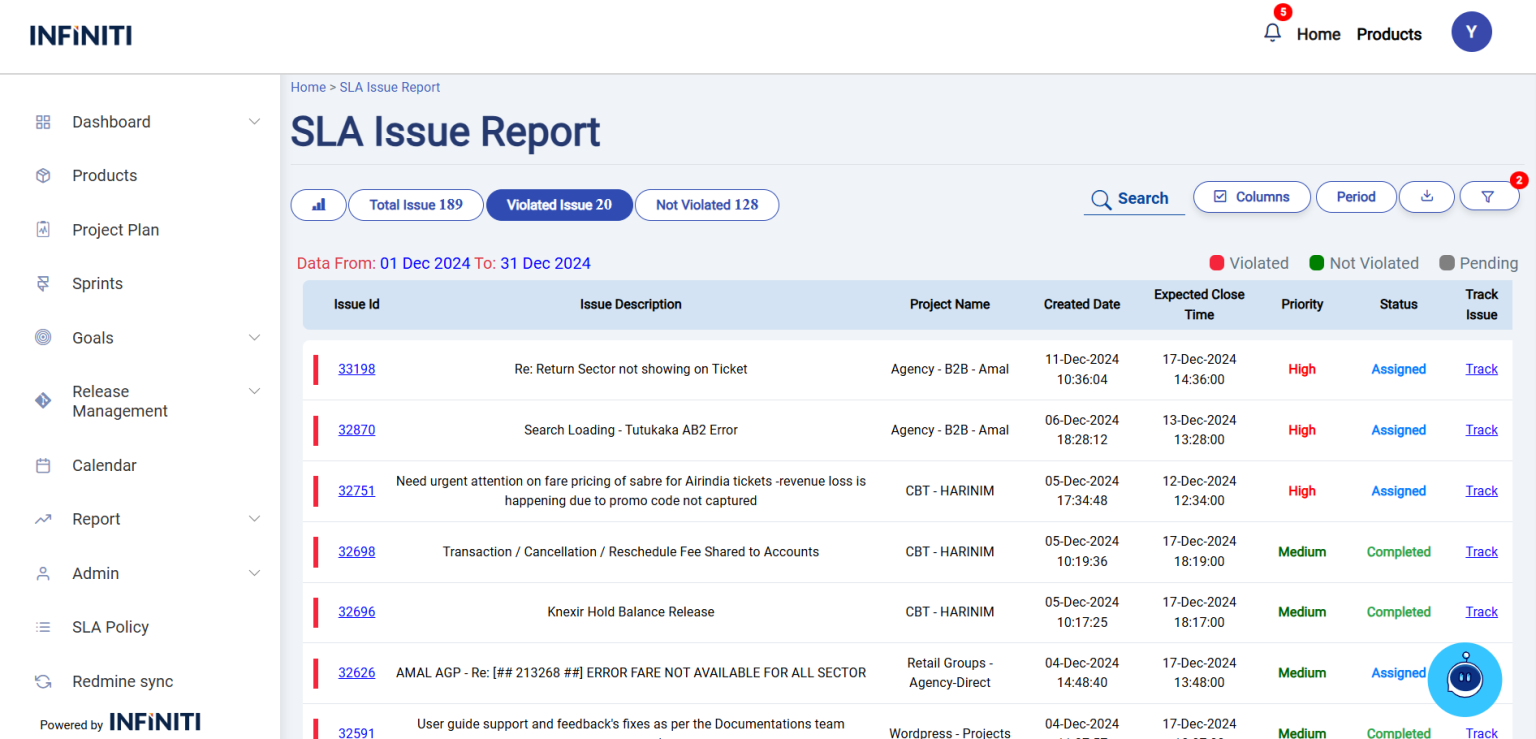
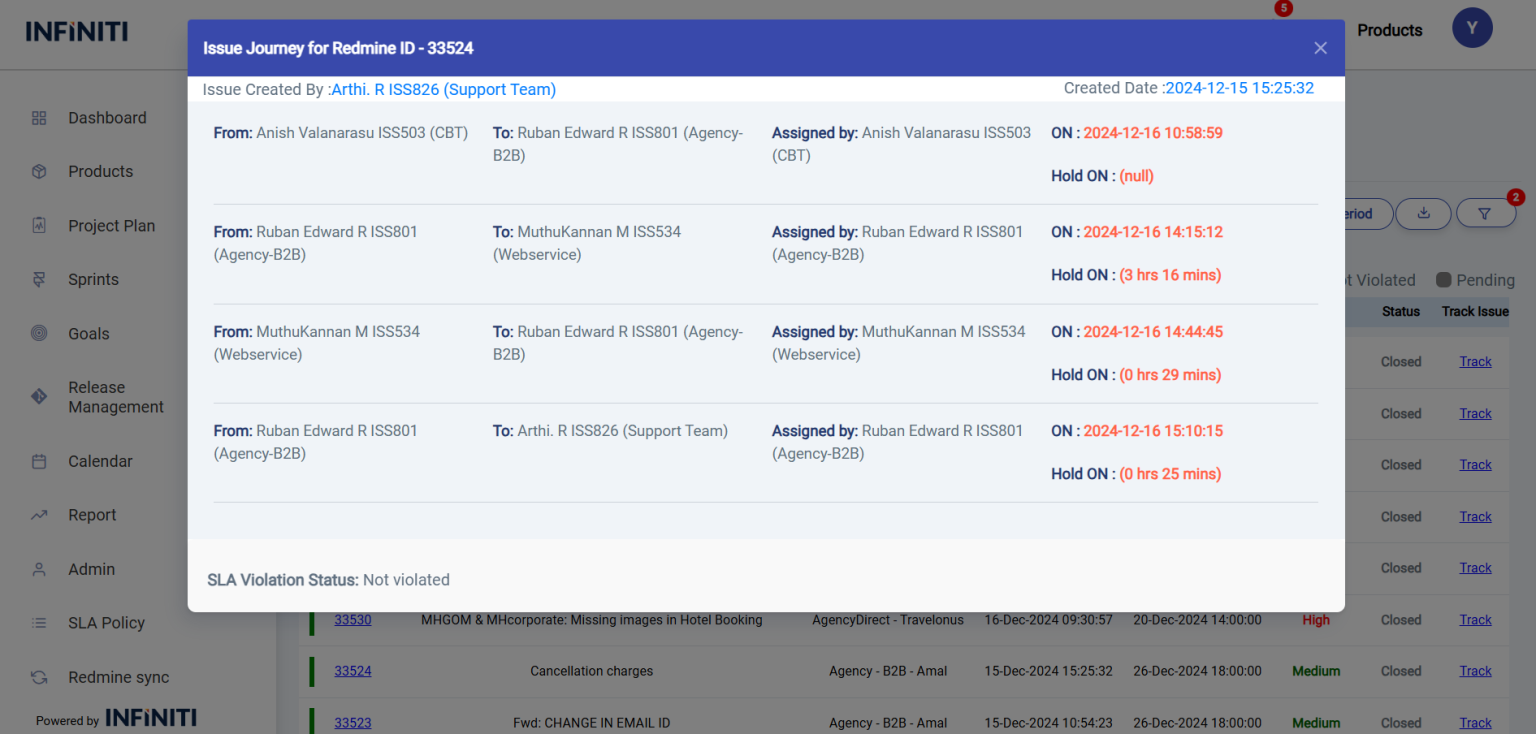
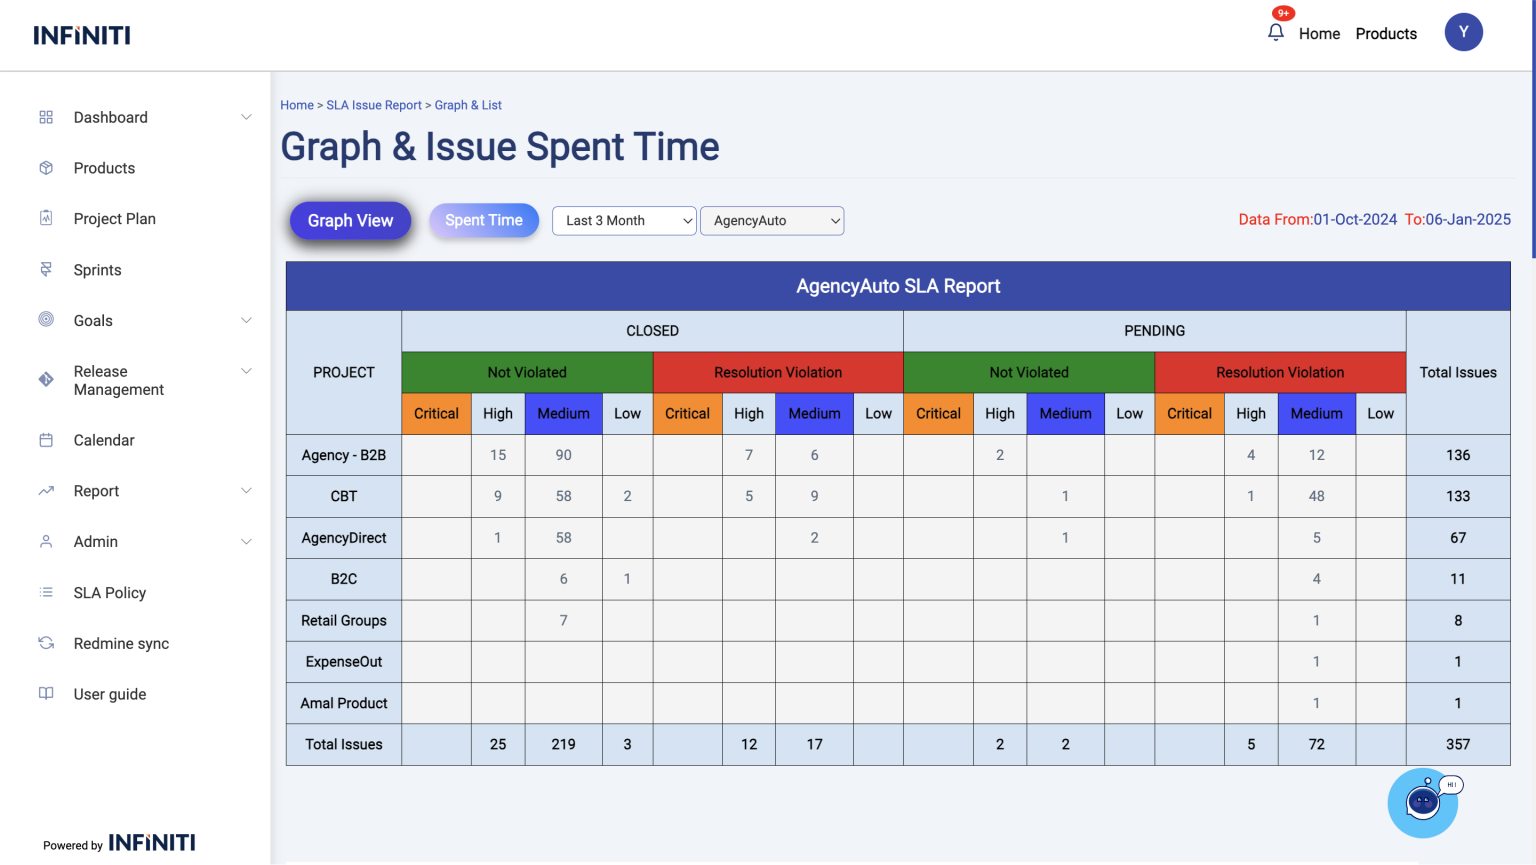
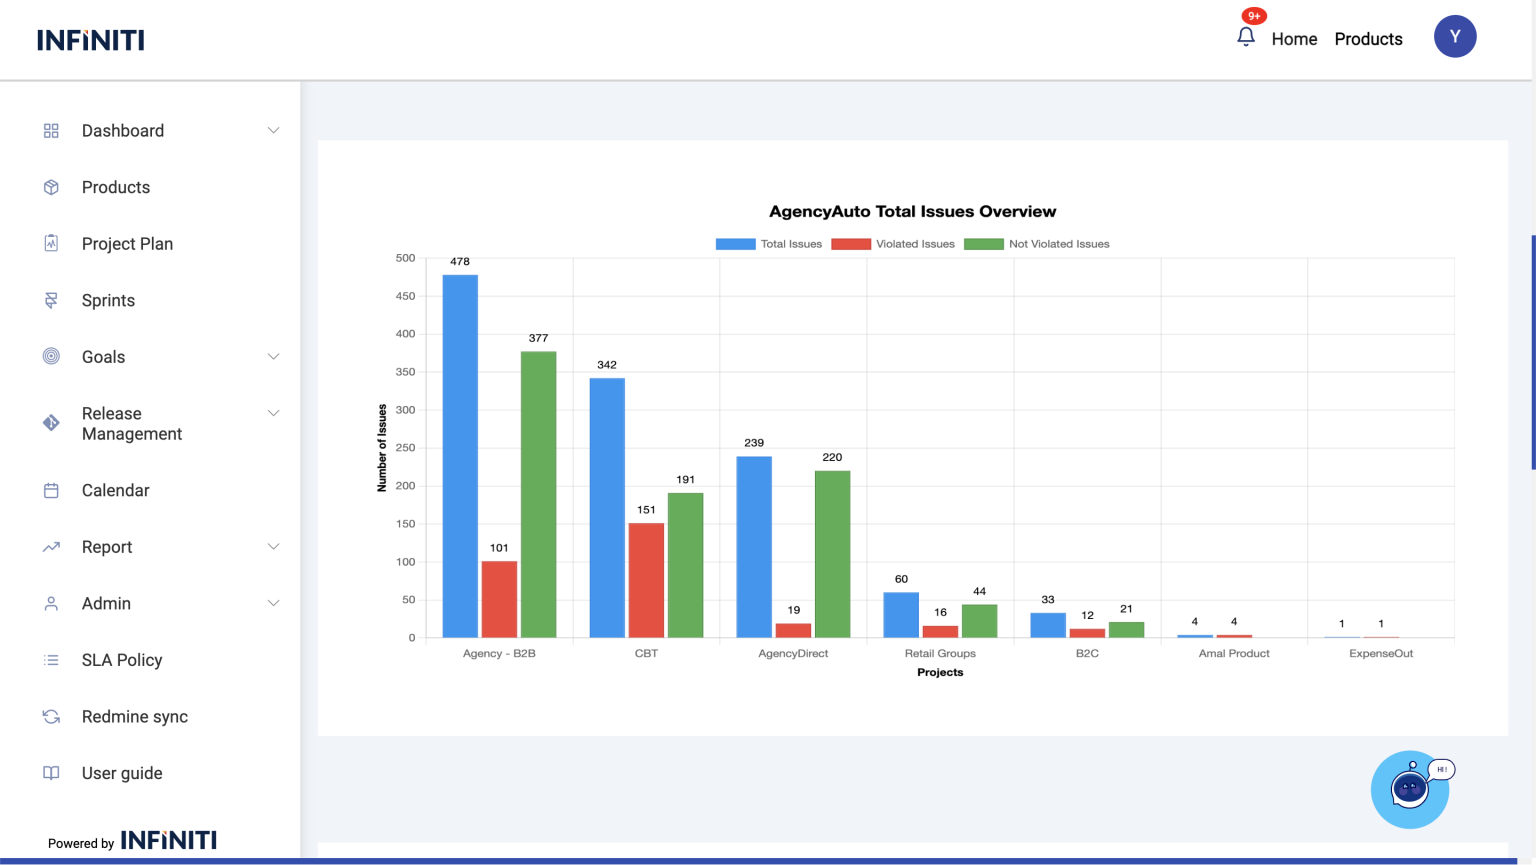
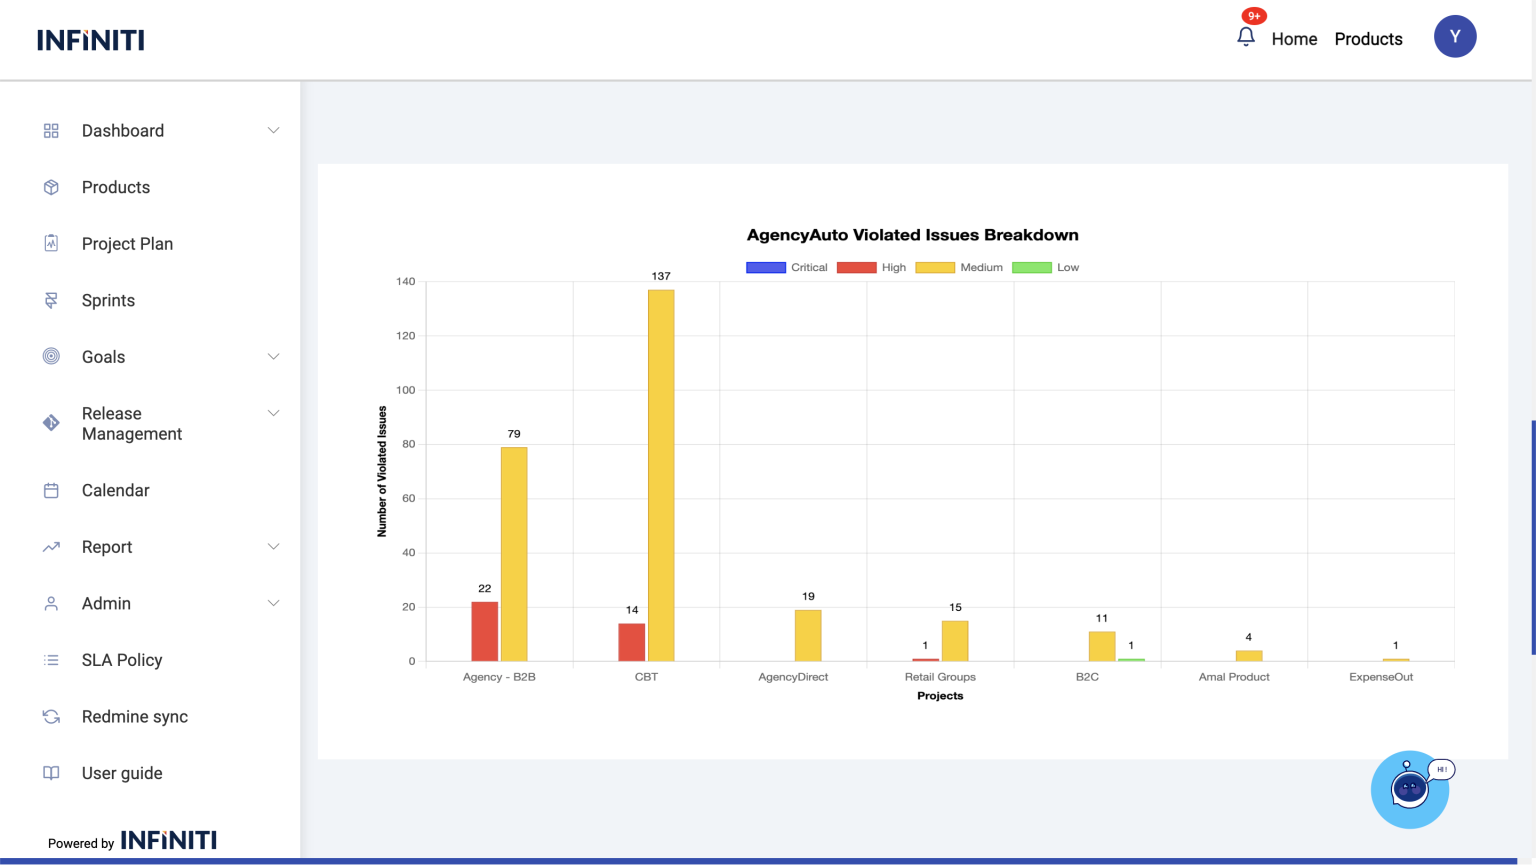
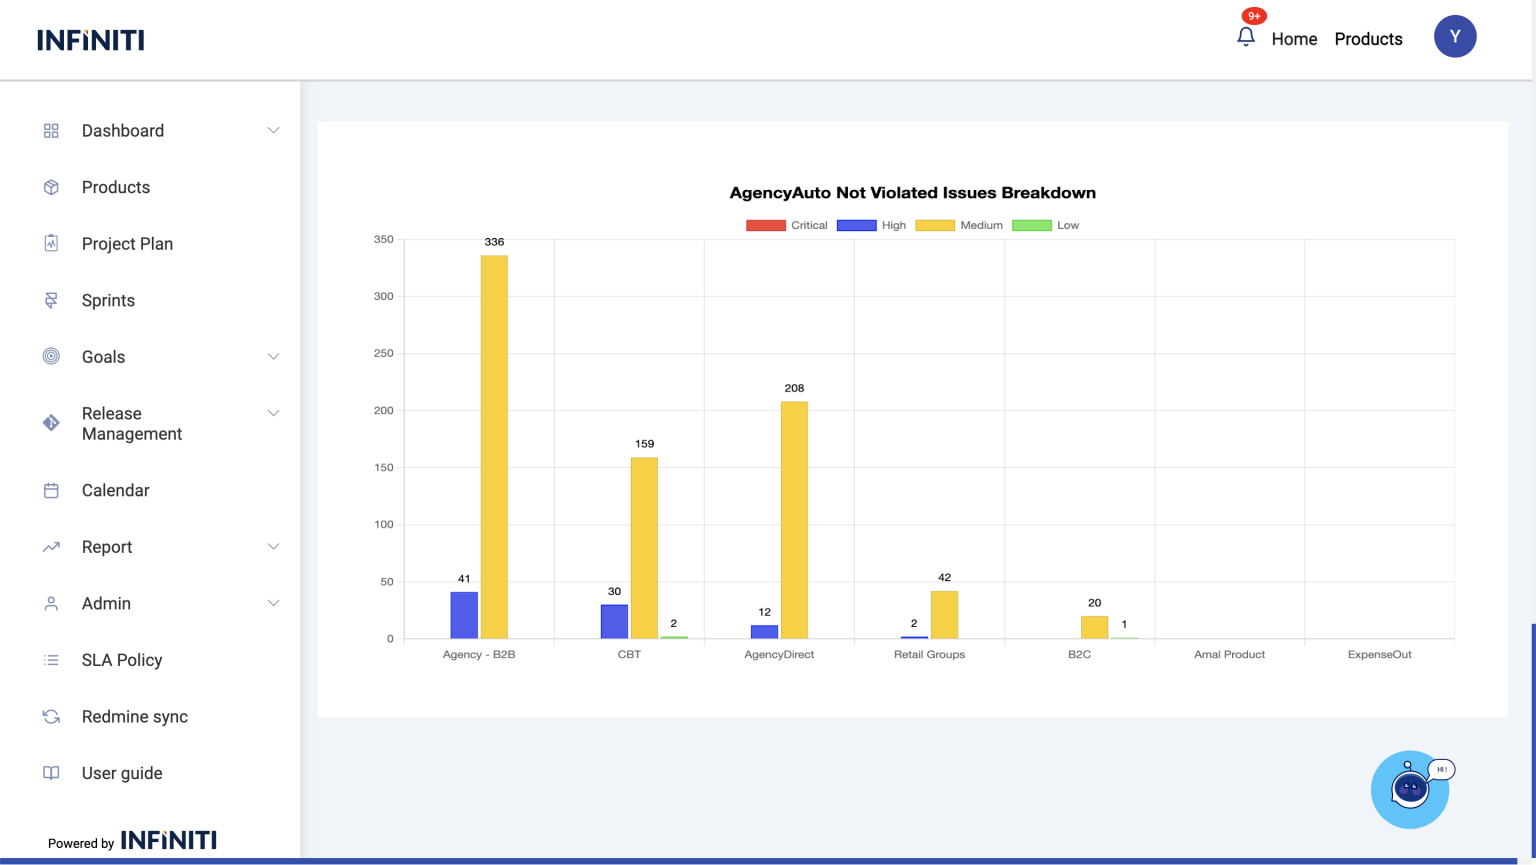
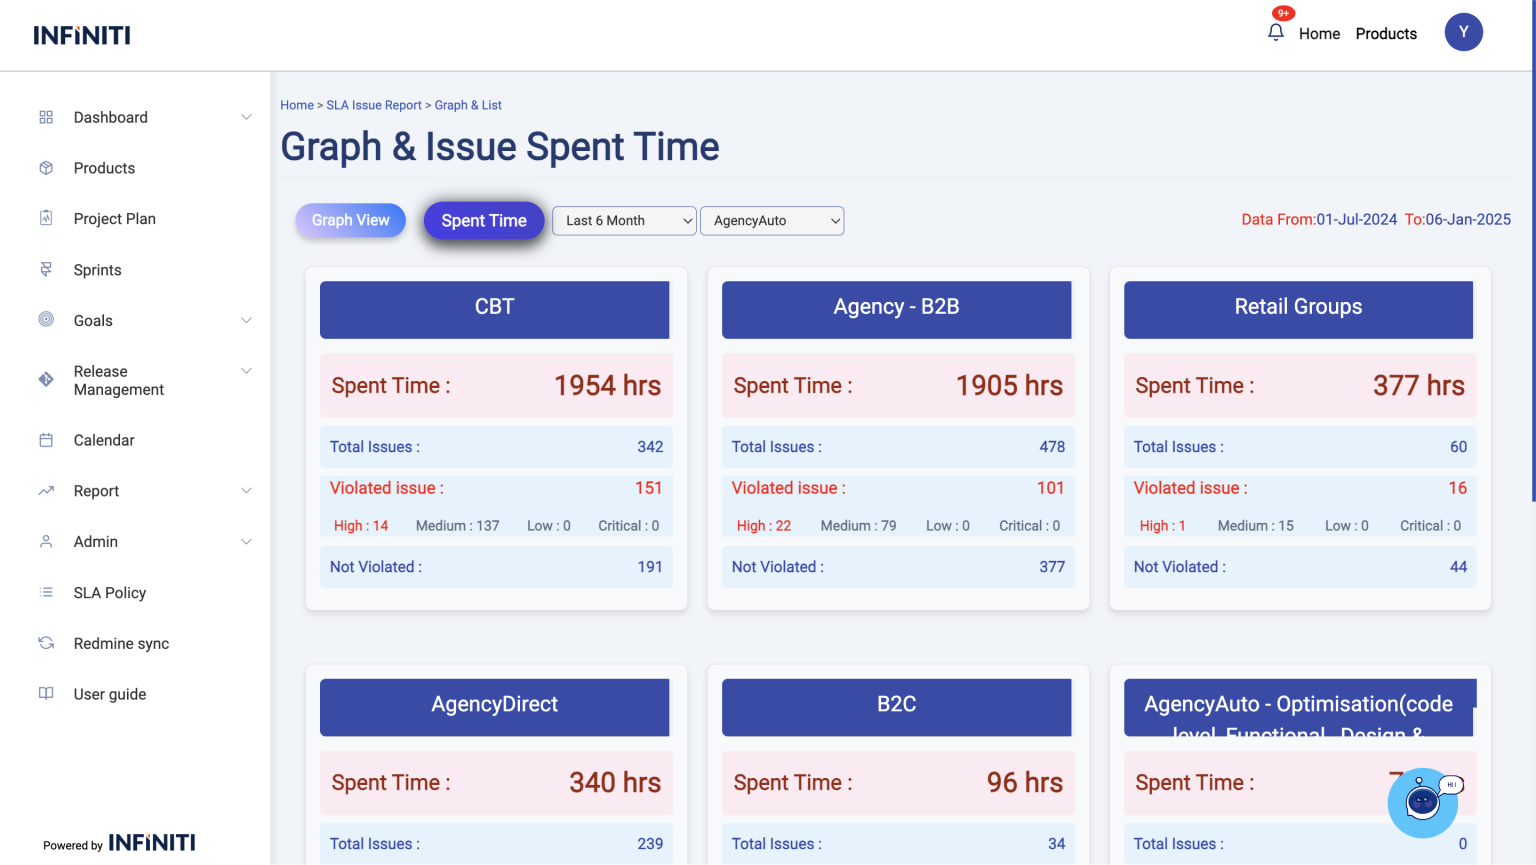
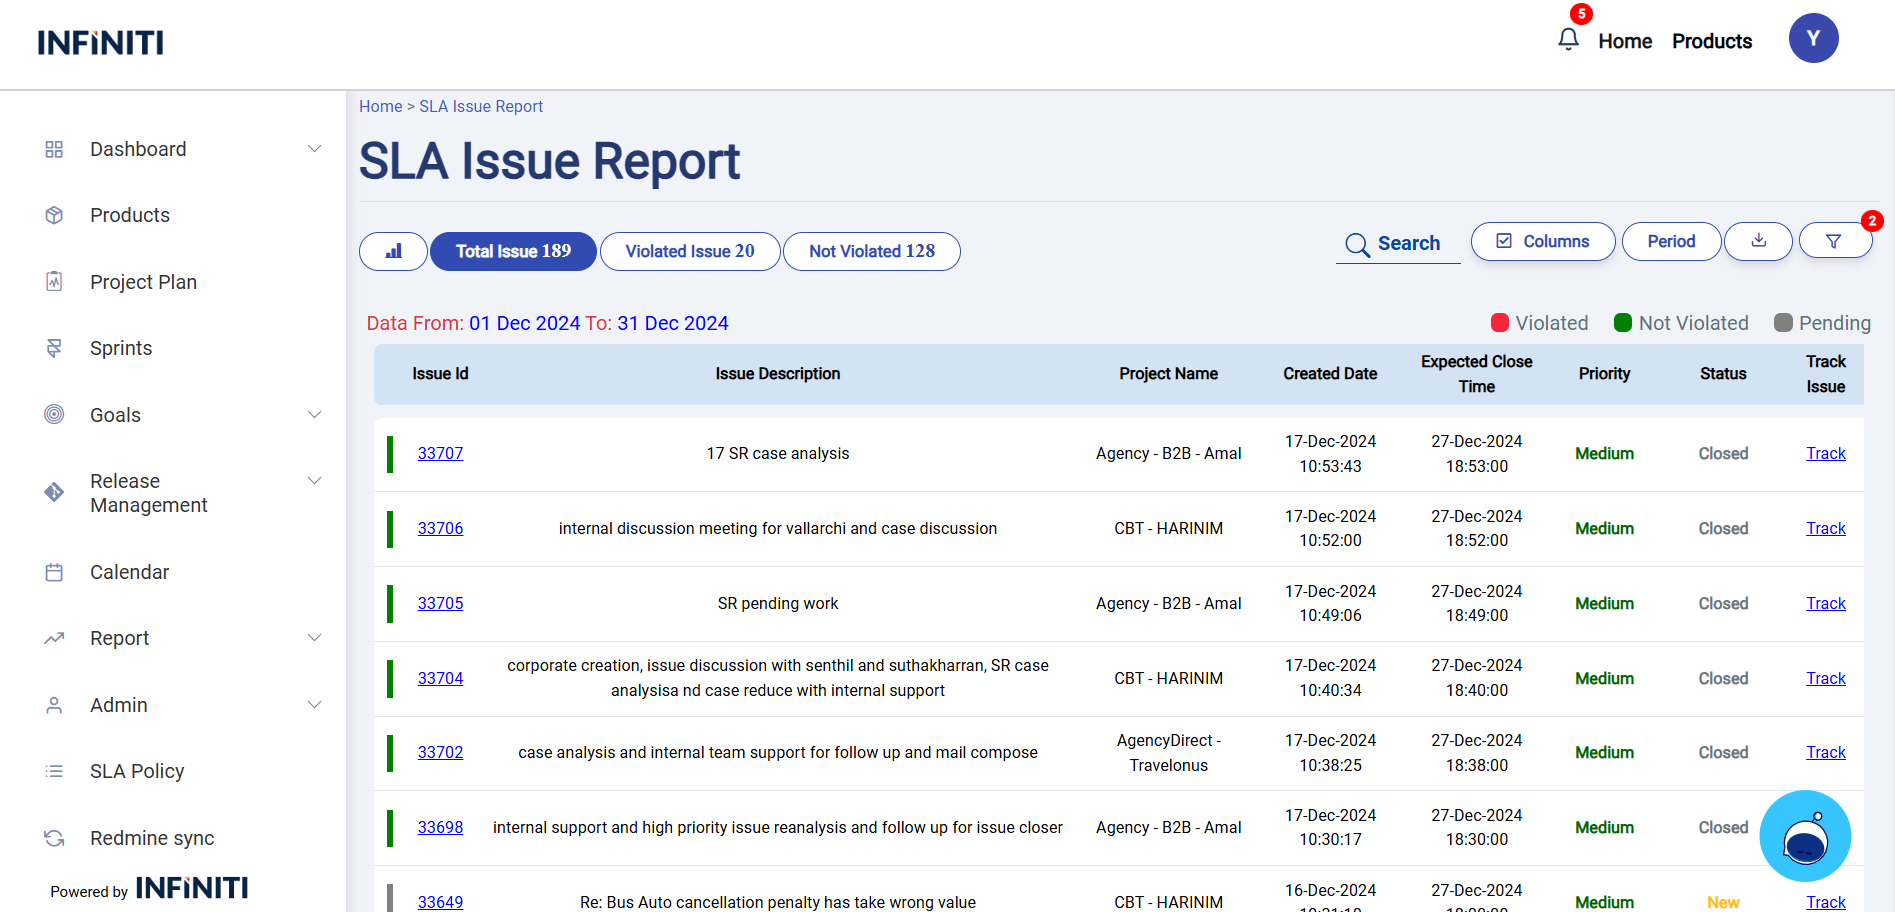
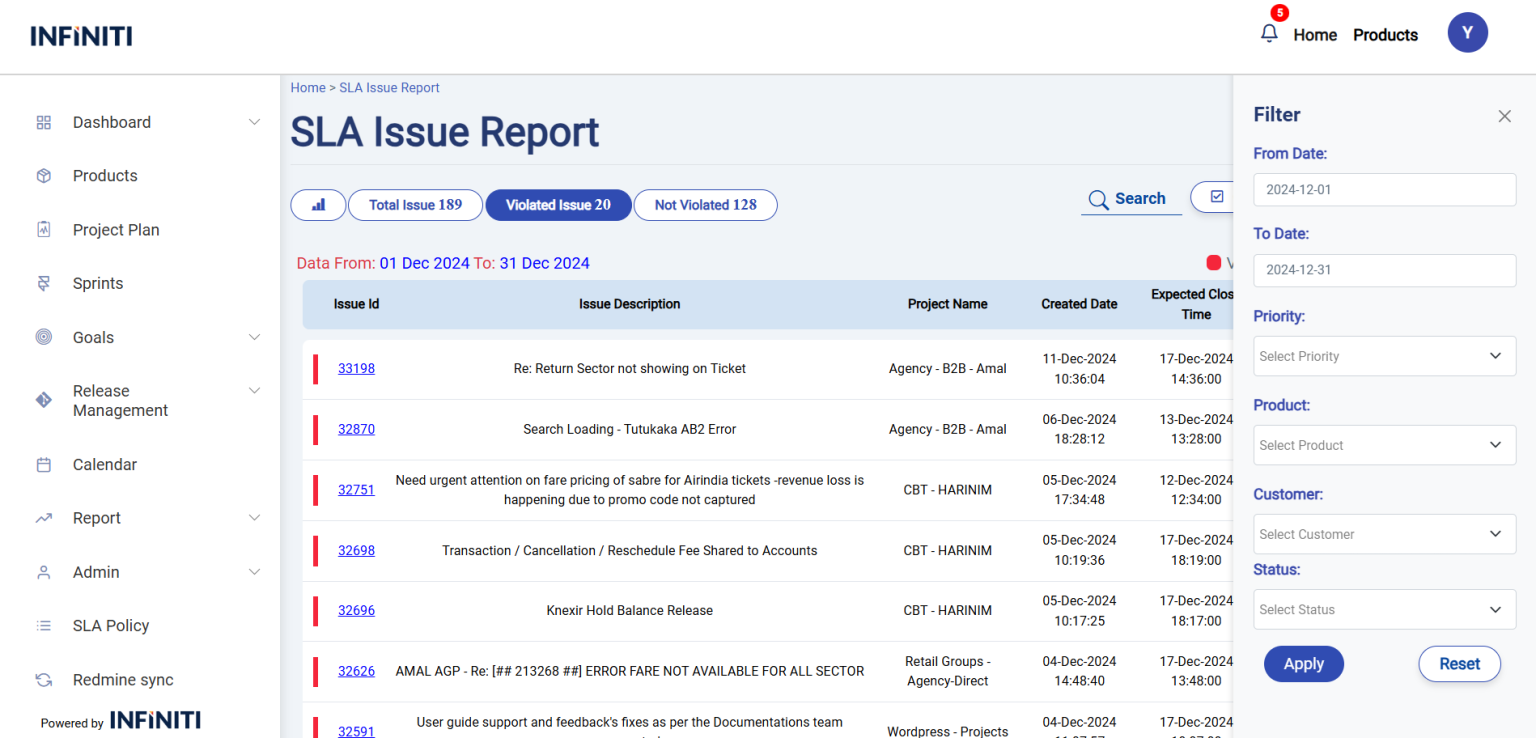
The SLA Violation Report allows users to filter issues by clicking the “Violated” or “Not Violated” buttons. This feature makes it easy to view and focus on specific issues based on their SLA status
Functionality:
i. Issue List Display
-
- Filtered by product: Only project linked to the user’s product are shown.
- No data message: Displays ‘No data found’ if there are no sprints.
- Issue Id: Redirect’s to Redmine Ticket
- Track Issue: Help to track the Issue
ii. Buttons visibility and functionality
-
- Graph Button: Clicking the ‘Graph’ button redirects you to the Graph page.
- Total Issue: Clicking the ‘Total Issue’ button will display all live issues within a specified date range.
- Violated Issue: Clicking the ‘Violated Issue’ button will display all violated issues within a specified date range.
- Not Violated Issue: “Clicking the ‘Not Violated Issue’ button will display all non-violated issues within a specified date range.”
- Search Filter: Clicking the ‘Search’ button allows you to search for issues by their issue ID.
- Column Button: Clicking the ‘Column’ button allows you to view the data in a format that suits your preference.
- Period Button: Clicking the ‘Period’ button provides a quick date filter for selecting a specific time range.
- Download Button: “Clicking the ‘Download’ button allows you to download data for a specific date range and filtered criteria.”
- Filter Button: Clicking the ‘Filter’ button allows you to apply any filters according to your preferences.
iii. Filter options:
-
- Start Date filter:
- Enable users to filter results by selecting a start date using a date picker input.
- End Date filter:
- Enable users to filter results by selecting a end date using a date picker input.
- Priority filter:
- Provide a priority filter allowing users to sort or filter results based on predefined priority levels.
- Start Date filter:
-
- Product filter:
- Allows the user to refine the issue details by selecting specific products.
- Customer filter:
- Enables filtering based on customer information.
- Status filter:
- Helps narrow down the issue by their current status (e.g., Open, In Progress, Completed).
- Product filter:
iv. Apply filter:
-
- When the user clicks the “Apply” button, the report updates to show only the backlog items that match the selected filter criteria.
v. Reset filter:
-
- The “Reset” button clears the applied filters, returning the report to its original state where all backlog items are displayed. The form fields are also reset to their default values, removing any previously selected filter options.
vi. Download report:
-
- If the user clicks the download button, the report will be downloaded in Excel format with all the data.
Enable users to track issues by providing tools for monitoring, updating, and reviewing issue statuses and progress, with calculations based solely on business hours.
viii. Pagination:
-
- The report displays 10 entries per page, with navigation options to move between pages for easier data management.
- Next and Prev buttons are used for page navigation in the reports. The Prev button is displayed only when a previous page is available, and the Next button is displayed only when a next page is available.
Graph and Spend time:
-
-
Here is a graph displaying closed and pending issues, while another page shows the time spent on live issues for a particular product on a monthly basis. This will be very useful for tracking the time spent on live issues and improving the efficiency of issue handling.
-
i. Filter by month and product :
-
- The data can be filtered monthly and product-wise to view the graph and analyze the time spent on issue handling.
-
- Here is a report page that provides a monthly breakdown of pending and closed issues. The report includes detailed data on issues categorized by priority levels such as high, medium, low, and critical.
- This monthly product-wise summary helps in identifying trends, assessing the resolution rate, and prioritizing efforts to address critical issues effectively. By analyzing this data, teams can better plan their resources and improve overall issue management.
-
The report details are presented in a graphically designed, user-friendly format, providing a clear view of priority-wise issue data. This layout ensures better visualization and easy analysis of issues categorized by priority, helping users quickly identify trends and focus areas for improvement.
-
- The issues are organized by project, showing total issues, non-violated issues, and violated issues. The report includes the project name, issue count, and monthly data, with options to filter by project or month. This data is displayed in a graphical format for easy analysis.
-
-
The graph represents violated issues categorized by priority levels—critical, high, medium, and low. It displays the data product-wise and monthly-wise for better analysis.
-
-
- The graph represents non-violated issues categorized by priority levels—critical, high, medium, and low. It displays the data product-wise and monthly, providing a clear overview for better analysis.
- This page displays the time spent on handling live issues, categorized by product and filterable by month or year. It provides valuable insights into issue-handling times, helping to identify areas for improvement and reduce time consumption.