The Gantt chart view for the project plan provides a detailed timeline, displaying milestones and tasks on a daily, weekly, or monthly basis for effective scheduling and tracking.
Functionality:
i. Access control
- Milestone and task association: The Sprint view page is accessible only if the sprint is associated with the product linked to the user.
ii. Page layout
- Button: Positioned on the left side at the top of the page:
- Days button:
- Function:Renders a Gantt chart displaying milestones and their associated tasks in a day-wise timeline for precise daily tracking.
- Weeks button:
- Function: Displays a Gantt chart showing milestones and tasks organized in a week-wise timeline, providing a broader view of progress over multiple days.
- Months button:
- Function: Presents a Gantt chart with a month-wise timeline, offering a comprehensive overview of tasks and milestones over an extended period.
- Zoom-In button:
- Function: Zooms into the Gantt chart timeline to provide a more detailed view of milestones and tasks within a specific timeframe, enhancing focus on finer details.
- Zoom-Out button:
- Function: Zooms out of the Gantt chart timeline, offering a broader perspective of milestones and tasks across longer timeframes.
- Days button:
- Horizontal scroll bar:
- Action: Users can click and drag the bar left or right to navigate through the timeline.
- Function: Allows users to view the full timeline of all tasks and milestones by scrolling horizontally, ensuring no tasks or milestones are missed in the Gantt chart display.
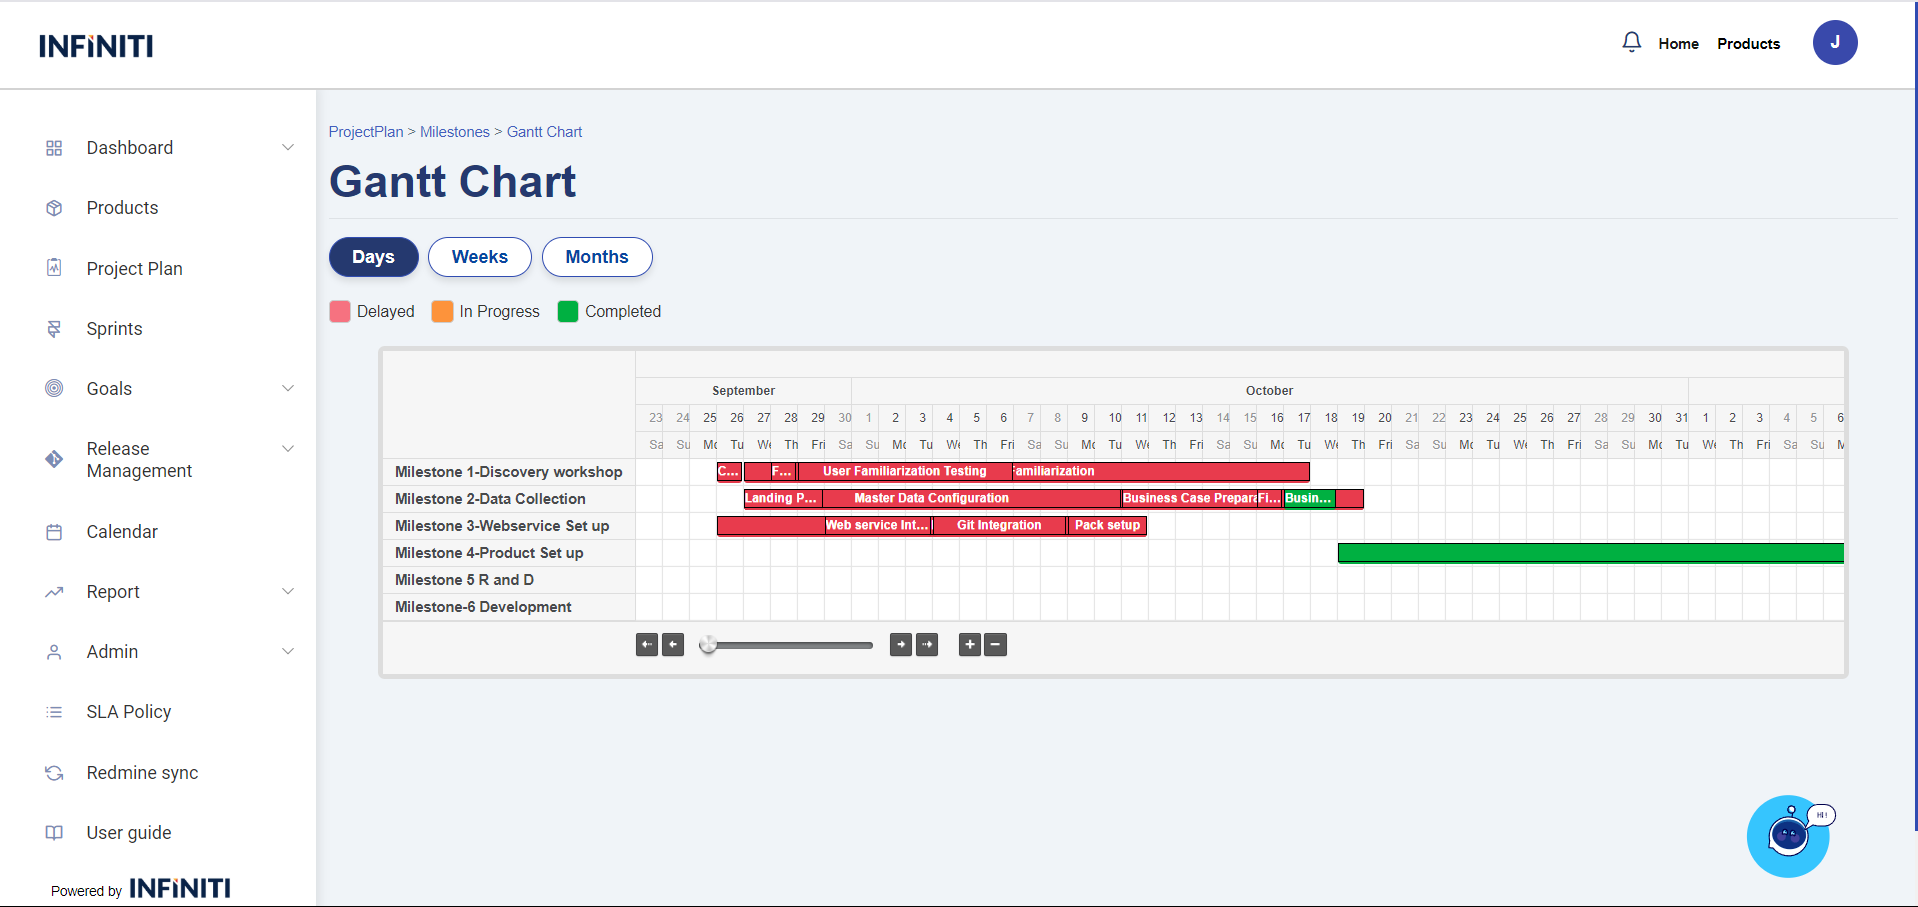
- Color-code box:
- Delay box : The delay box is represented in red, indicating tasks or milestones that are overdue and require immediate attention.
- In-progress box : The in-progress box is represented in orange, signifying tasks or milestones that are currently being worked on but are not yet completed.
- Completed box : The completed box is indicated in green, showcasing tasks or milestones that have been successfully finished.
- Button: Positioned on the left side at the top of the page:
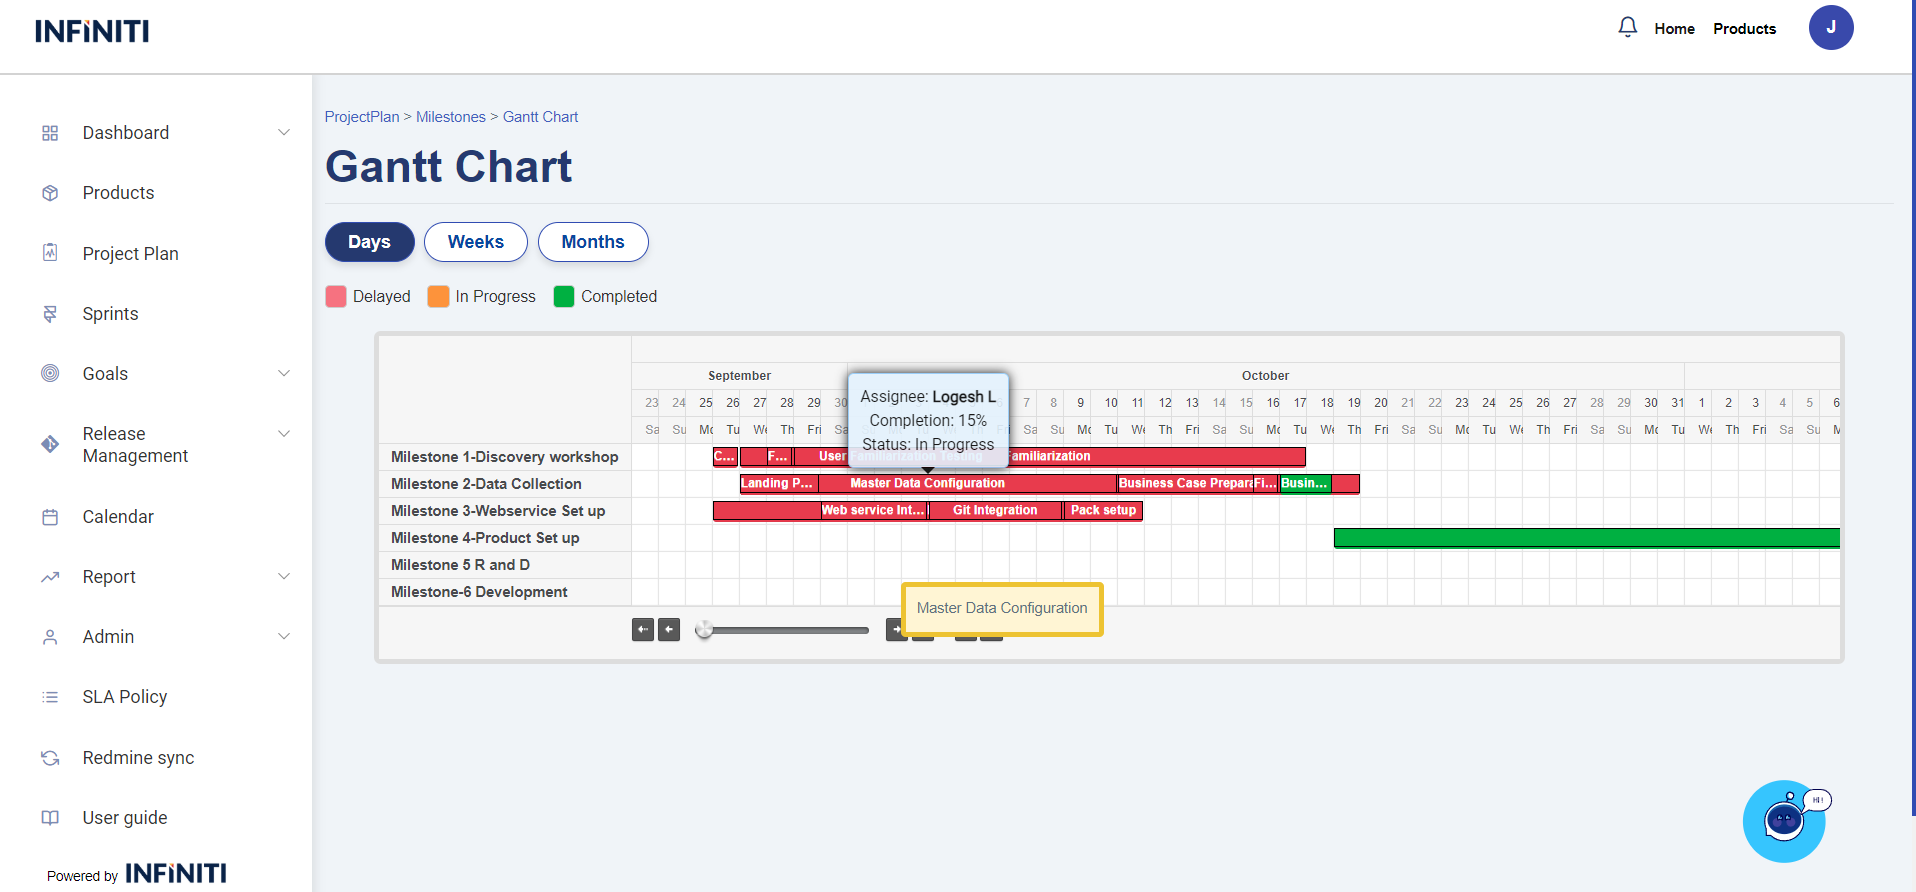
- Hover:
- Title:
- Task name : When hover on task shows the alternate name for task.
- Box view:
- Content: The box displays the assignee name, completion percentage, status in a compact view.
- Title:
- Hover:
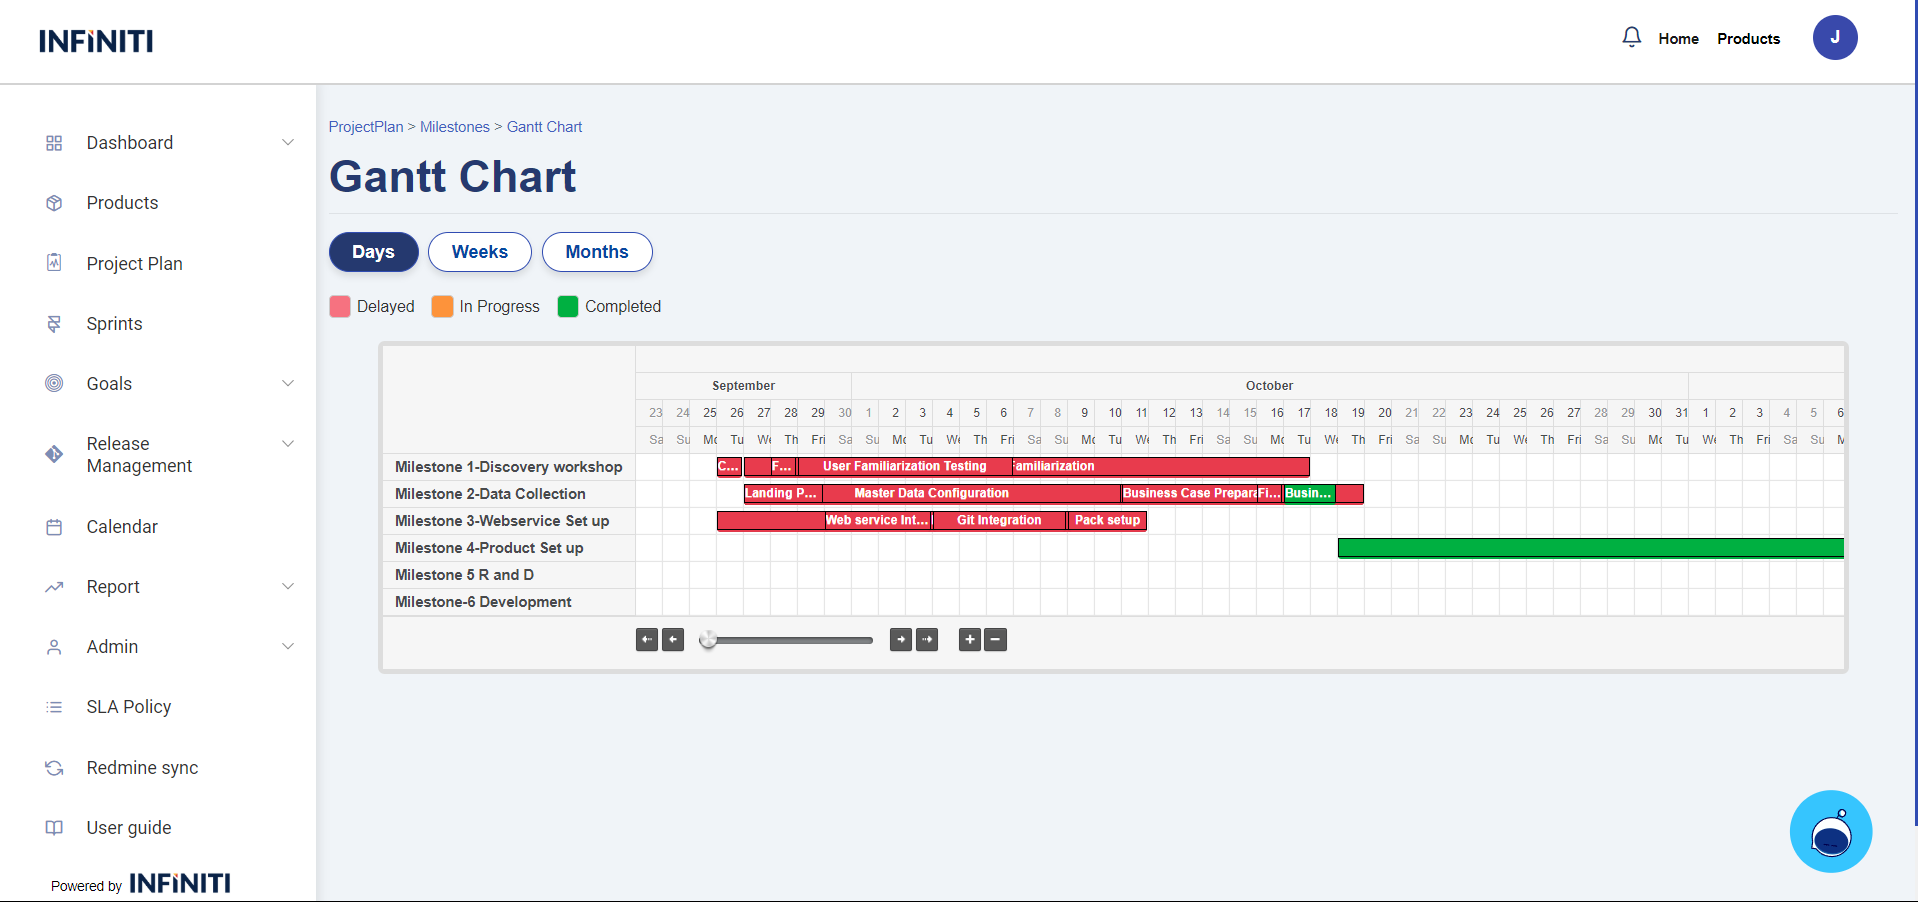
v. Days View
The Days View in the Gantt chart provides a detailed representation of the project timeline, focusing on individual days within each month:
Y-Axis (Milestones): The Y-axis lists all the milestones associated with the project plan. Each milestone is aligned with its corresponding tasks and timeline, allowing for easy identification and tracking of progress.
- X-Axis (Date and Day): Each column in the X-axis represents a specific day of the month, displaying the date and the corresponding day of the week in short form (e.g., “Mon,” “Tue”). This ensures a clear and concise timeline for daily tracking.
- Data Field (Tasks): Within the chart, tasks are displayed under their respective milestones as data fields. These tasks are positioned according to their start and end dates, providing a clear visualization of their duration and progress.
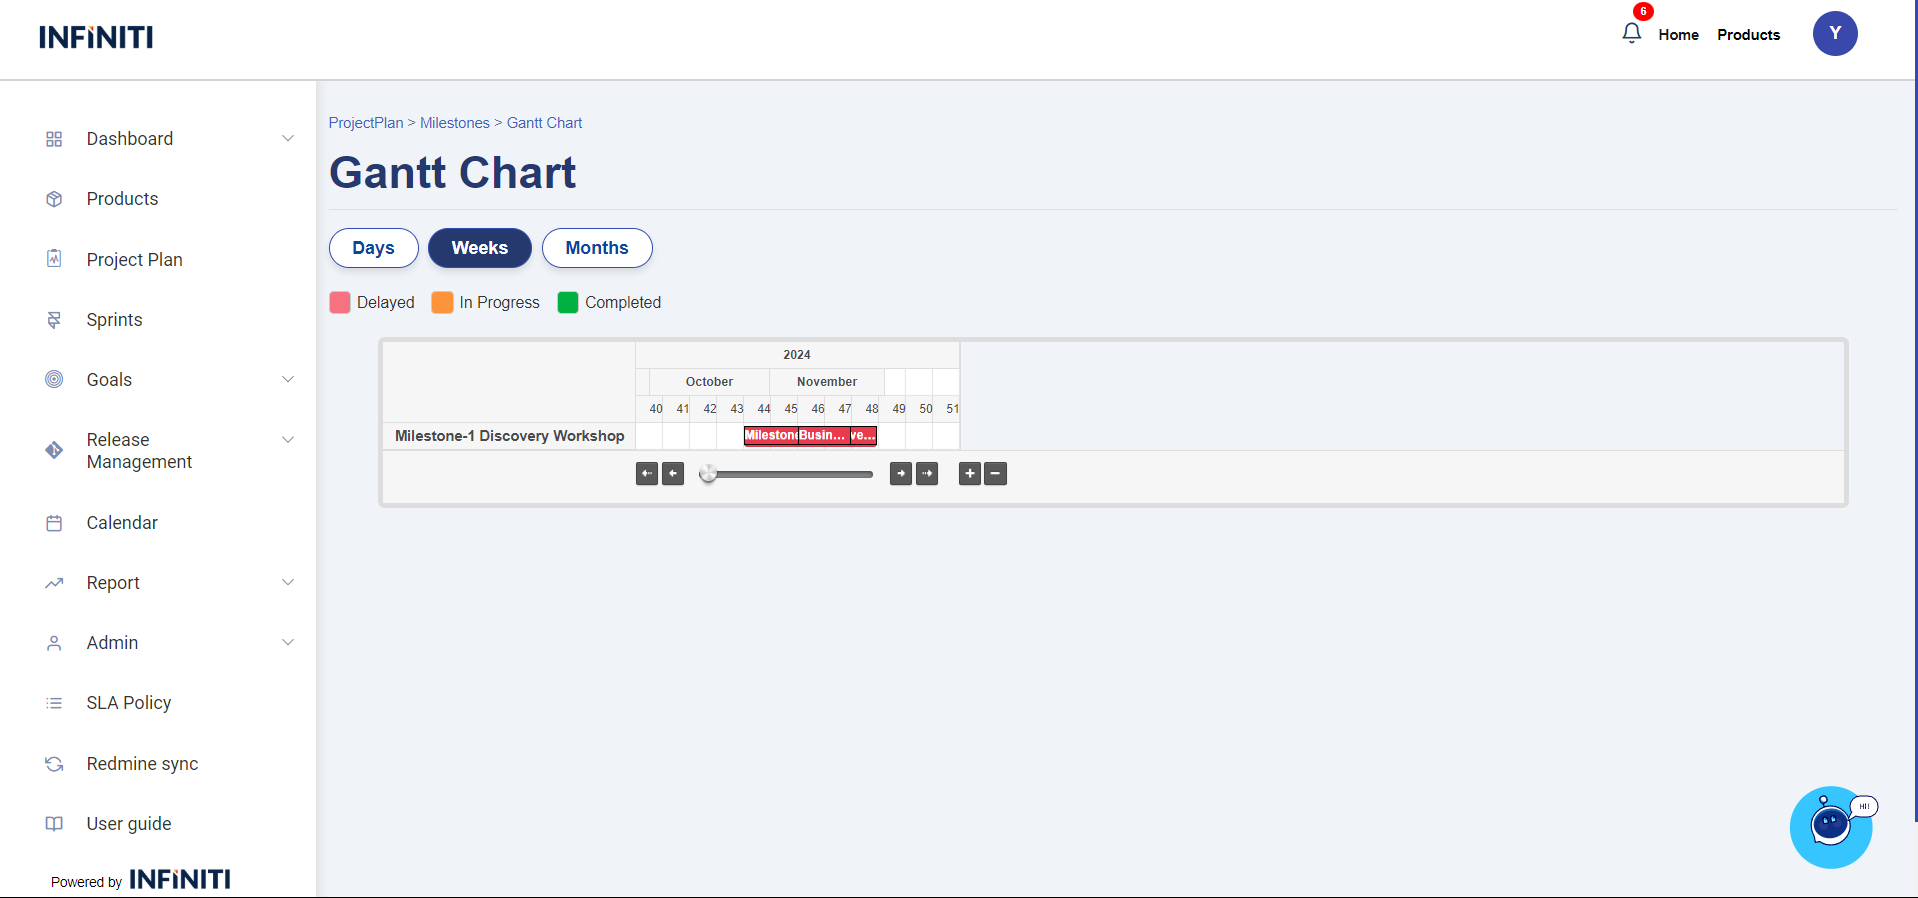
vi. Weeks View
The Weeks View in the Gantt chart provides a clear and structured representation of the project timeline:
- X-Axis Representation: The X-axis displays each month divided into numerical weeks, offering a precise weekly breakdown for better time tracking. For example, the weeks of January may be represented as Week 1, Week 2, Week 3, and Week 4, providing an intuitive and organized view of the timeline.
- Y-Axis Representation: The Y-axis lists all milestones associated with the project plan. Each milestone is aligned with its respective timeline on the X-axis, enabling users to see when specific milestones are planned to start and end.
- Tasks in Data Field: The tasks linked to each milestone are displayed within the Gantt chart’s data field. These tasks are visually placed according to their start and end dates, making it easy to identify their duration, dependencies, and progress within the context of the milestone timeline.
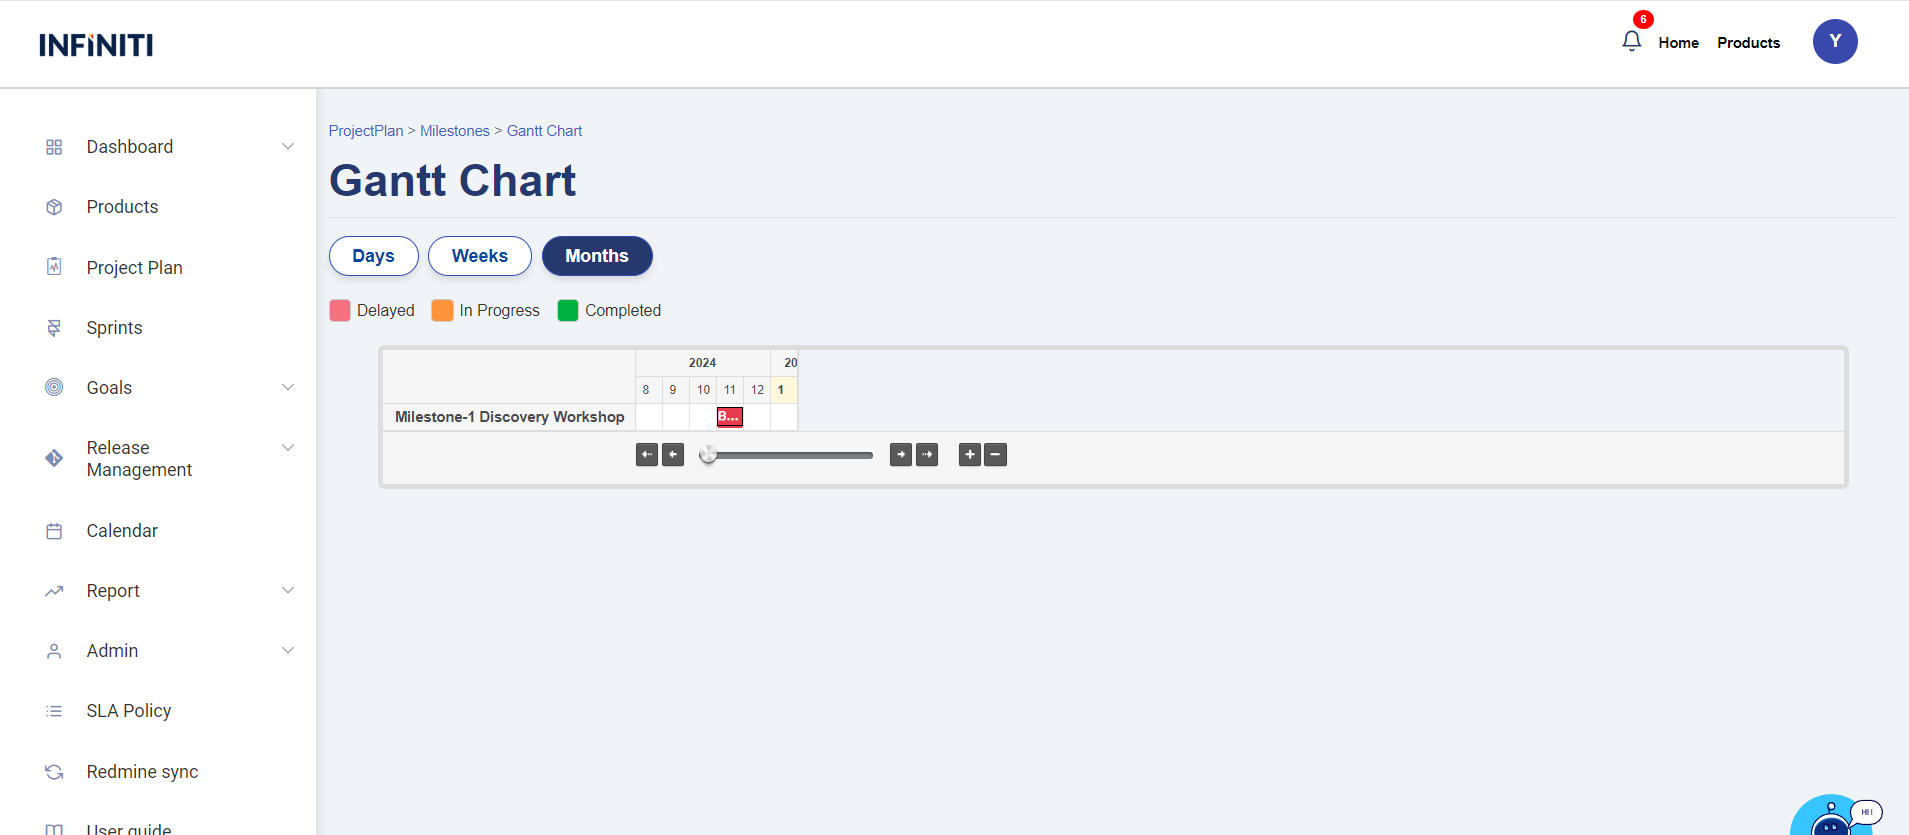
vii. Months View
The Months View in the Gantt chart provides a comprehensive timeline representation, making it easy to visualize project progress over a longer duration:
- X-Axis (Months): The horizontal axis displays the months in a clear and organized format, labeled with full month names such as “January,” “February,” and so on. This allows users to quickly identify the timeline for each milestone and task.
- Y-Axis (Milestones): The vertical axis lists the milestones associated with the project plan. Each milestone is displayed in a structured manner, ensuring a clear understanding of the project’s key deliverables.
- Data Field (Tasks): Tasks associated with each milestone are plotted within the chart. They are visually aligned with their respective milestones and mapped against the monthly timeline on the X-axis, providing a detailed breakdown of task progress and deadlines.