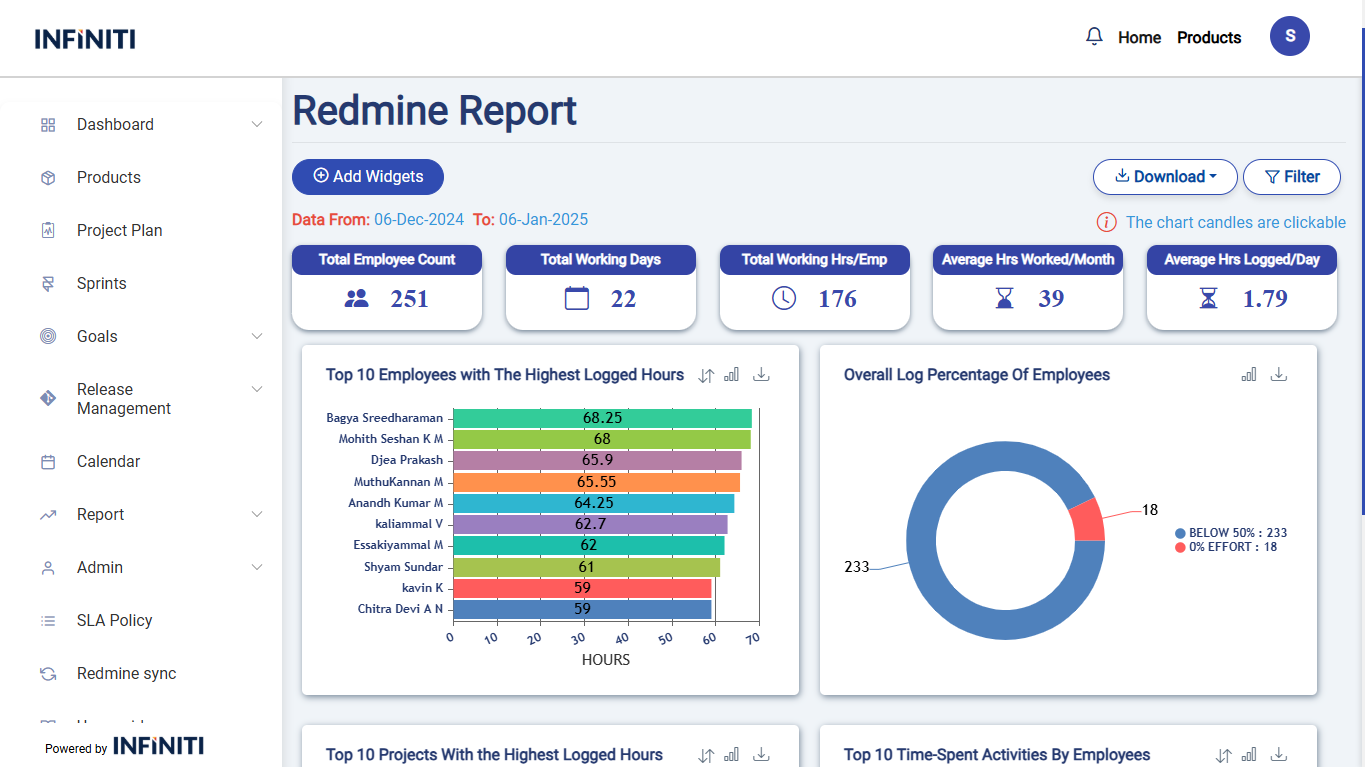
The Redmine Report offers a clear view of project performance and team contributions through four main charts on the dashboard, with additional charts available in widgets. The charts support data downloads, sorting, and dynamic type changes. The accompanying tables include search functionality for quick access to specific details, along with filters for team-specific and date-wise analysis, enabling efficient and customizable reporting.
Functionality:
i. Filter options:
- Date filter:
- The date filter allows users to refine the Redmine report by selecting a specific date range, including “From Date” and “To Date” options. By default, it displays data from the last one month, and users can apply filters for up to a maximum of three months of data.
- Team filter:
- The team filter enables users to narrow down the Redmine report by selecting specific teams for a focused view of the data.
- Apply filter:
- When the user clicks the “Apply” button, the report updates to show only the Report that match the selected filter criteria.
- Reset filter:
- The “Reset” button clears the applied filters, returning the report to its original state where all report are displayed. The form fields are also reset to their default values, removing any previously selected filter options.
- Date filter:
ii. Add widgets:
- Widgets provide additional insights by displaying supplementary charts and tables. They enhance the dashboard’s functionality with features like data downloads, sorting options, chart type switching, and search capabilities for deeper analysis.
- Make chart legends hoverable to highlight the corresponding data, and clickable to show detailed information or trigger specific actions related to the data. This enhances user interaction with the chart.
iii. Sort data:
- Easily sort the data to view the top 10 records or the bottom 10 records, allowing for quick identification of key trends and outliers.
iv. Change chart type:
- Easily switch between various chart types, including Pie, Bar, Doughnut, and Column charts, to visualize data in your preferred format for better insights and analysis.
v. Download charts:
- Effortlessly download charts as PNG images for sharing or presentations. Additionally, export table data in Excel format for further analysis and reporting.
vi. Download Report:
- Easily download comprehensive reports in PDF format, including all chart images and table data, to consolidate insights for presentations or documentation.
vii. Download Extra data:
- To add extra data to an Excel file, find the last row with data, then add your new content in the next available rows. Afterward, save and provide the updated file for download.
viii. Search:
- Search for the team name in the data, and if it’s not found, display a “Data Not Found” message. If the team is found, show the relevant information.
ix. Chart candles:
- Make chart labels clickable to trigger an event, and display the corresponding data in a table format when clicked. This allows users to view detailed information upon interacting with the chart.
x. Charts legends:
- Make chart legends hoverable to highlight the corresponding data, and clickable to show detailed information or trigger specific actions related to the data. This enhances user interaction with the chart.